Field guide
What each screen does and what to expect. Two minutes, start to finish.
Upload
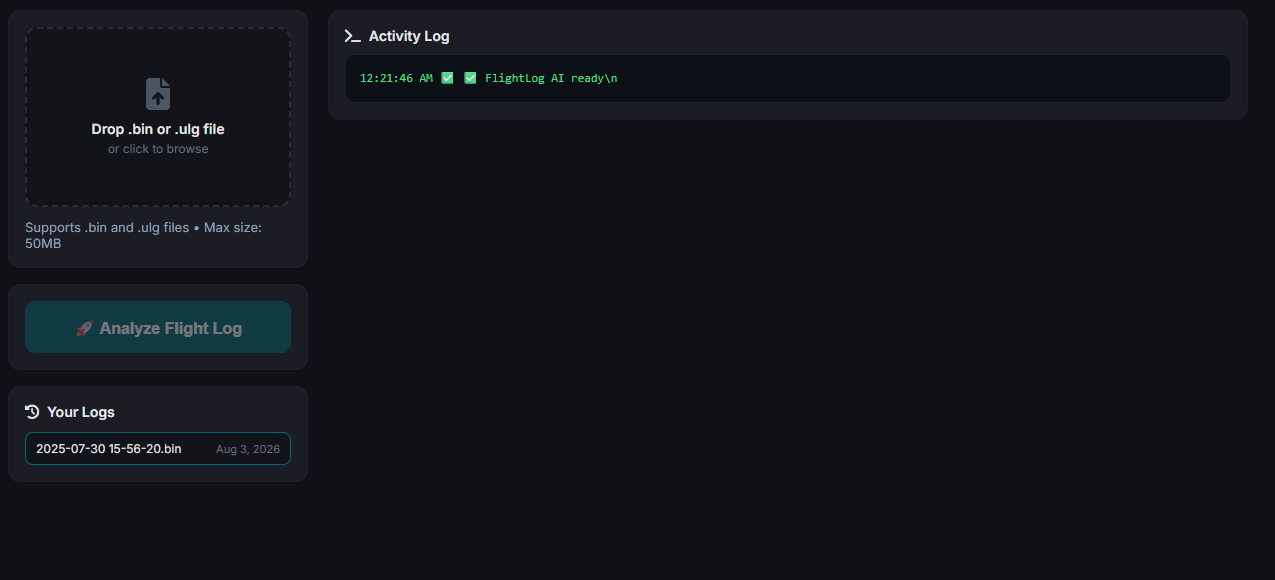
Drop an ArduPilot .bin or click to browse. Your tier's size limit is shown below the dropzone.
Analyze
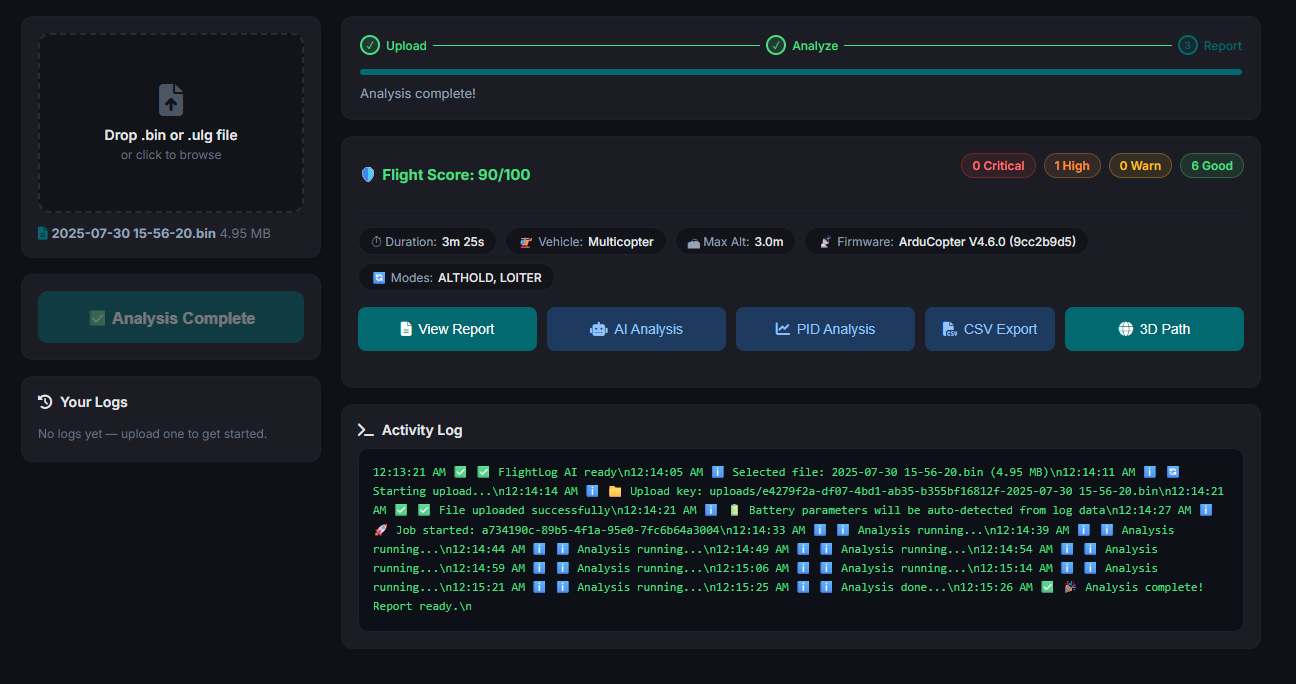
Click Analyze Flight Log. The activity log streams progress; done in about a minute for typical logs.
Report — summary
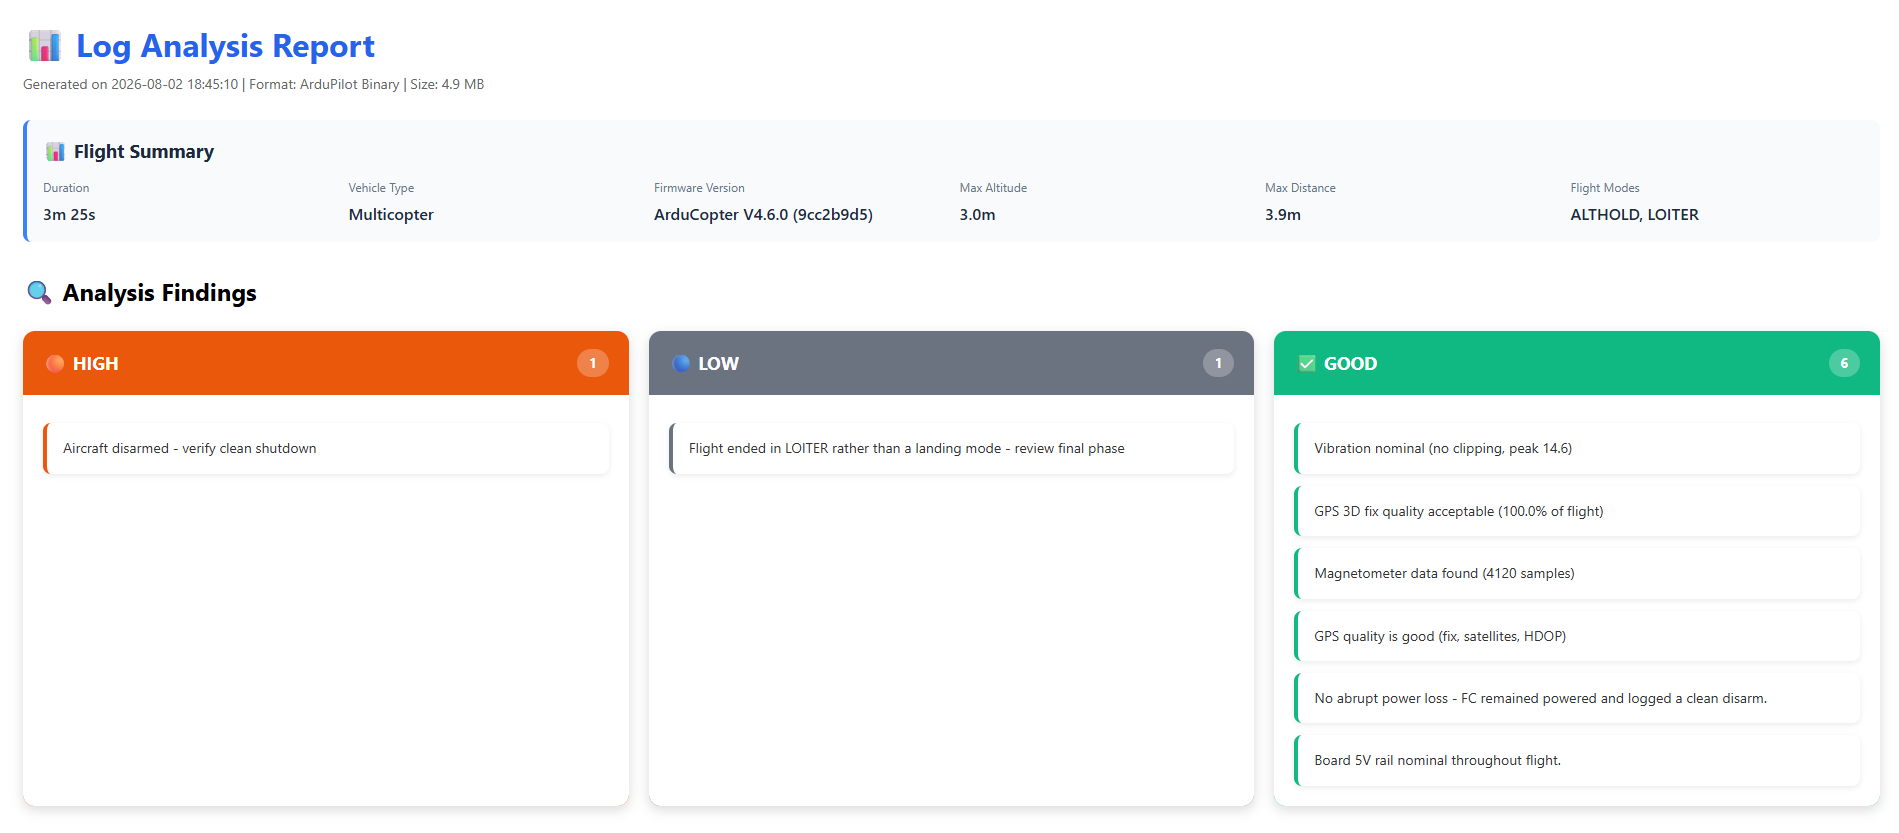
Flight summary and severity-ranked findings: what the log supports, stated with its limits.
Report — charts
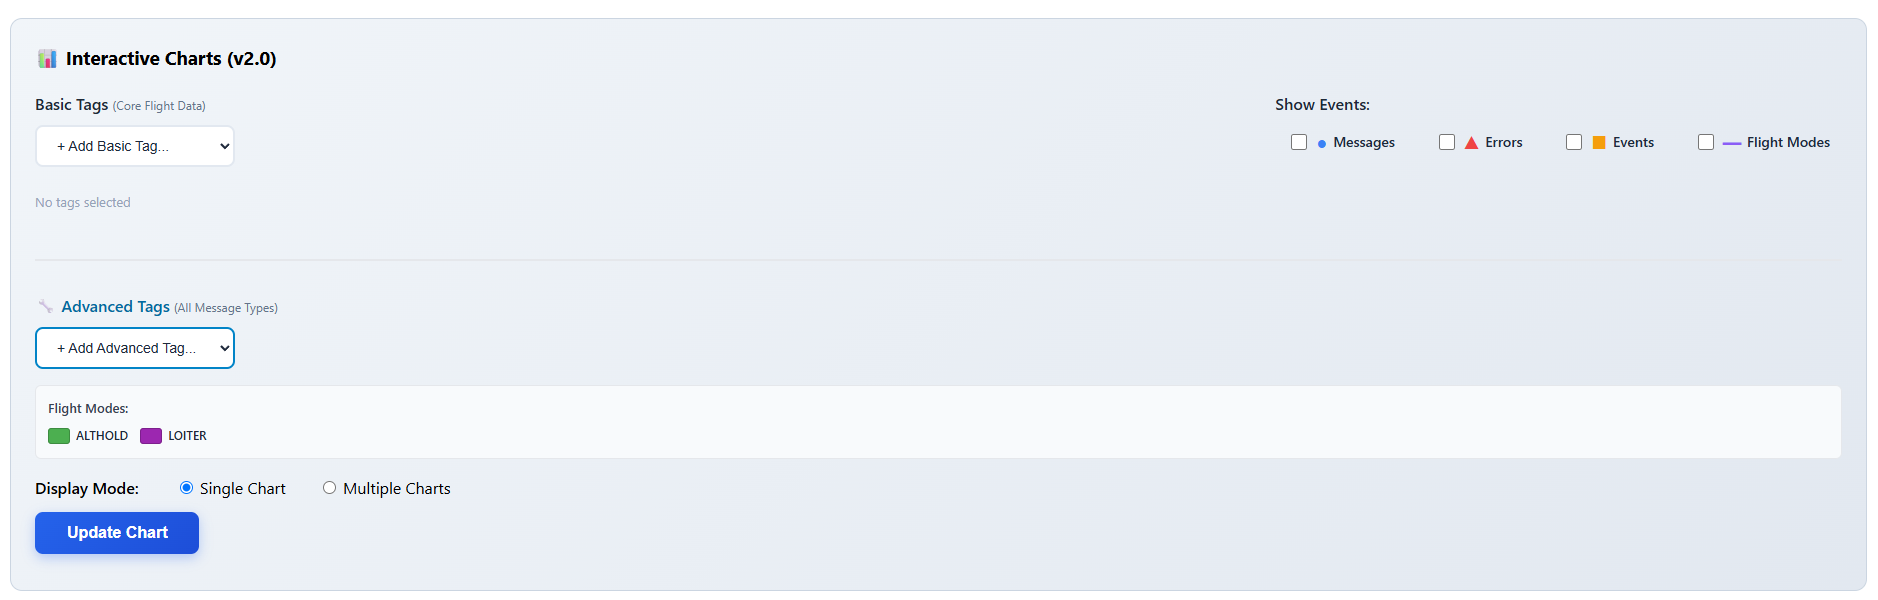
Interactive Charts: pick tags, toggle Show Events overlays (messages, errors, events, flight modes), and choose Single Chart (all traces on one plot) or Multiple Charts (one plot per parameter).
Basic tags
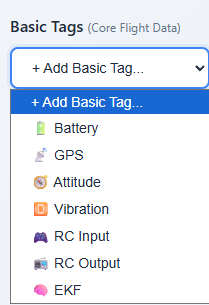
Core flight data — battery, GPS, attitude, vibration, RC in/out, EKF — one click each.
Advanced tags
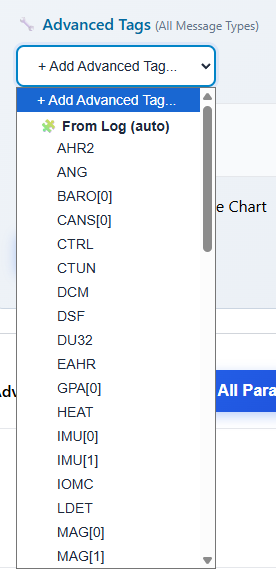
Every message type found in your specific log, auto-detected.
Tag cards
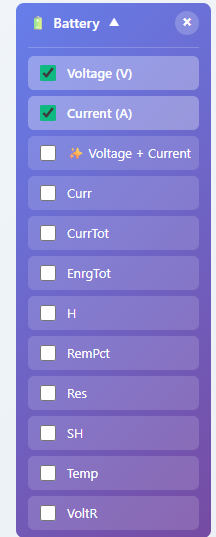
Each tag expands into its fields. Tick what you want plotted.
Graphs
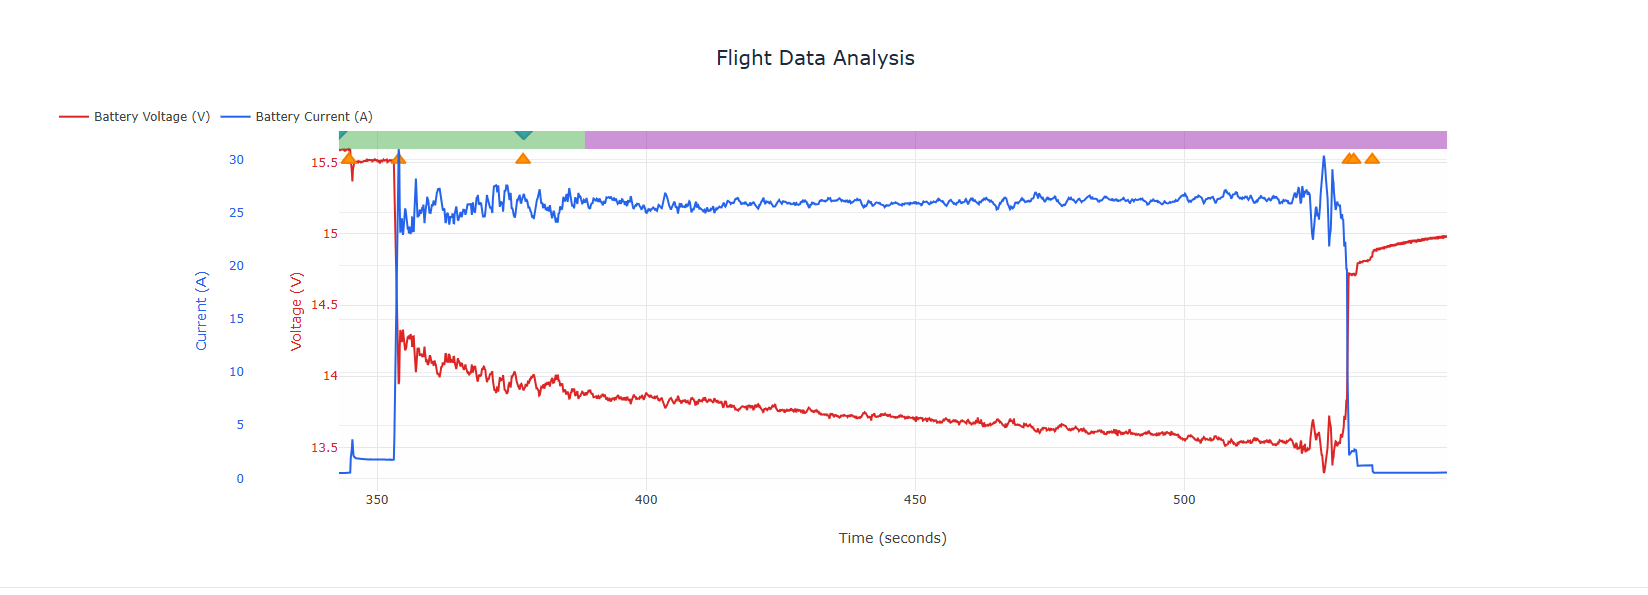
Plotly charts: zoom, pan, hover for exact values, export as image.
Events on graphs
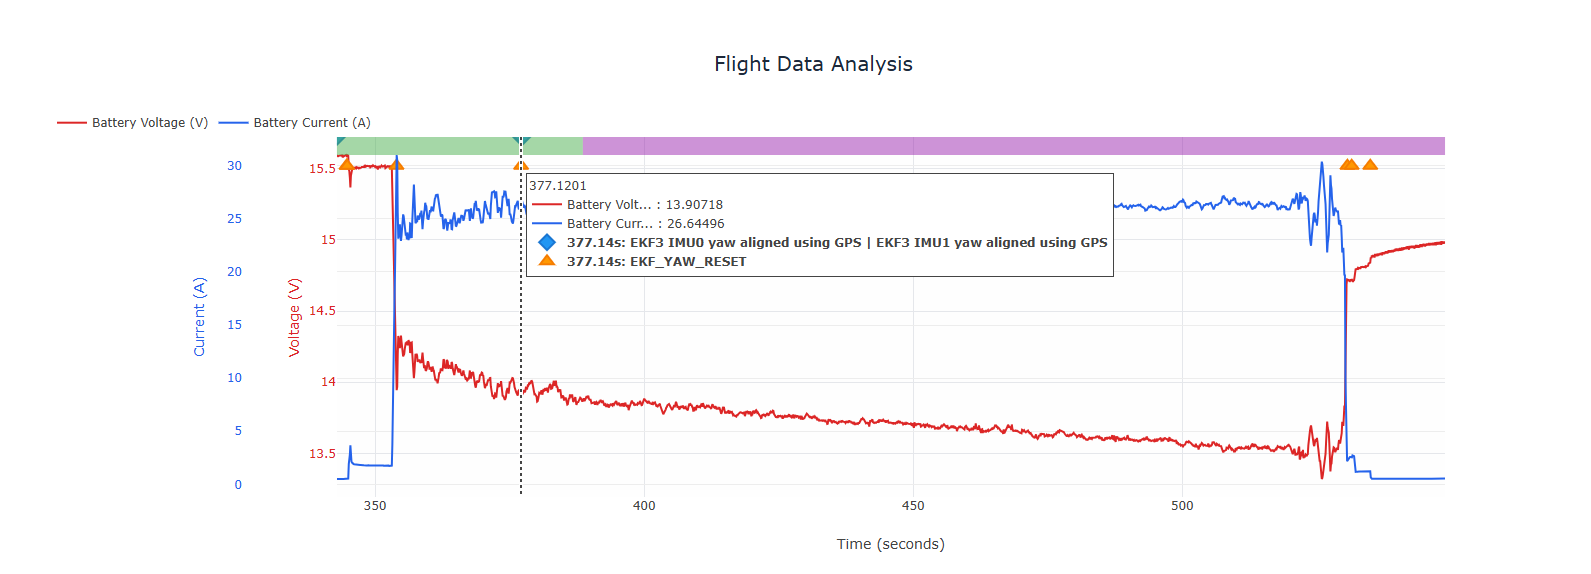
Log events and EKF messages ride on the timeline — hover a marker to see what fired at that second.
Single-parameter charts
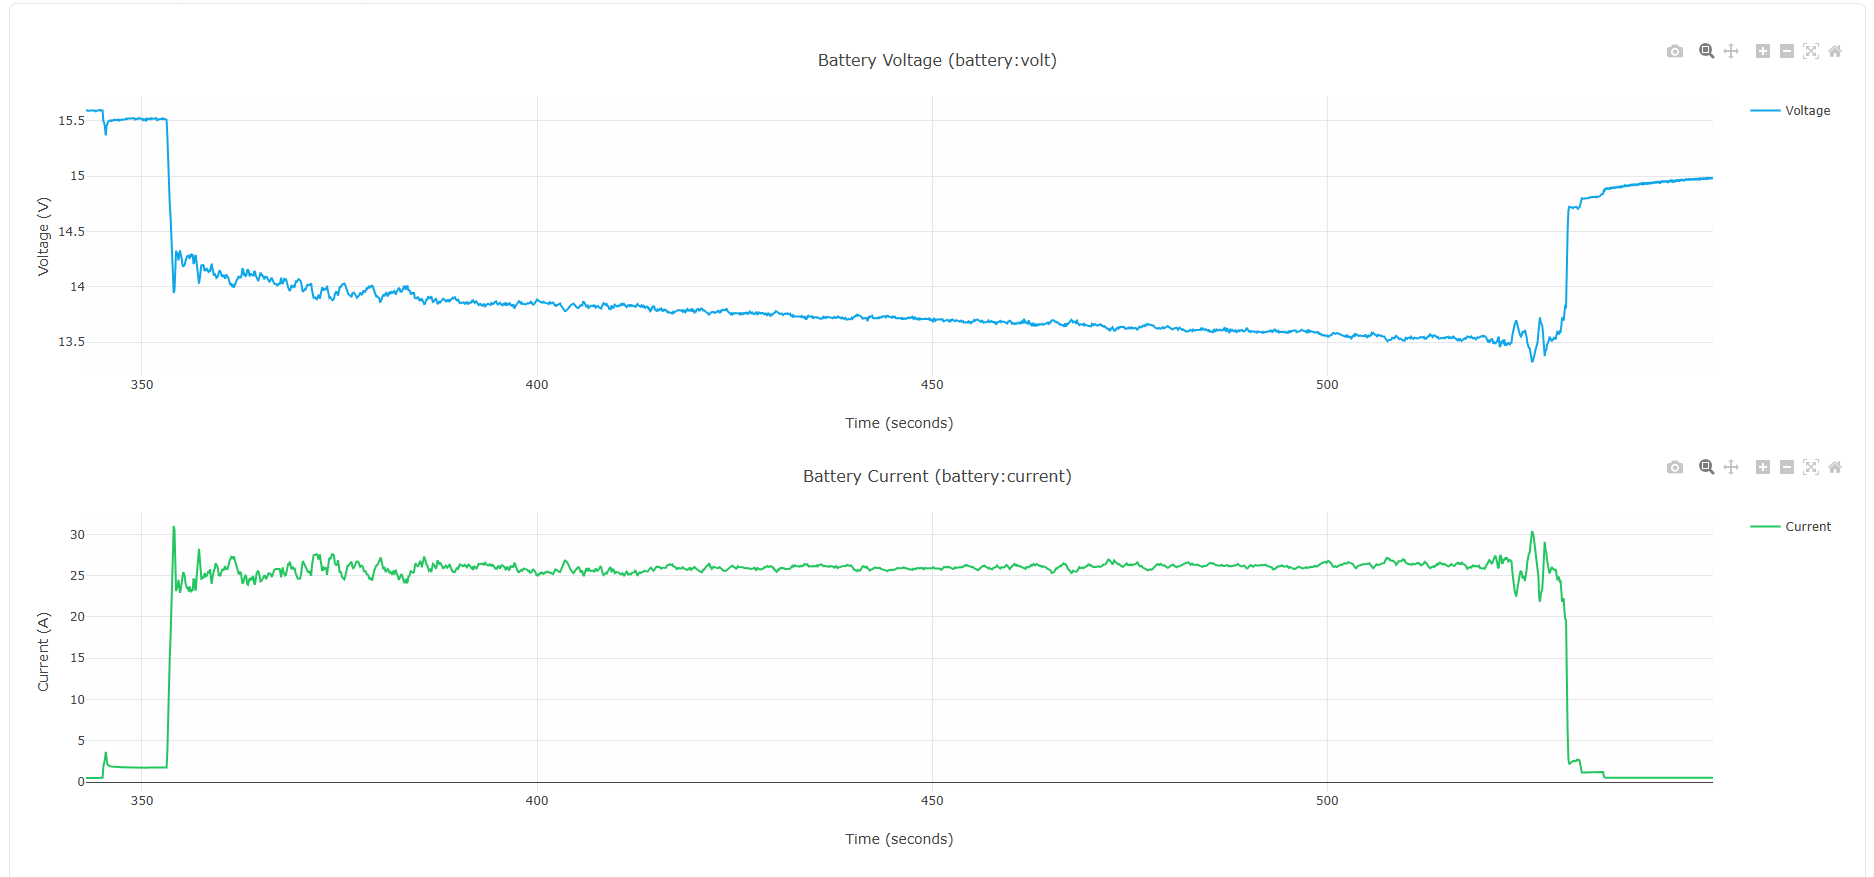
Multiple Charts mode gives each parameter its own axis — cleaner for comparing shapes.
PID analysis
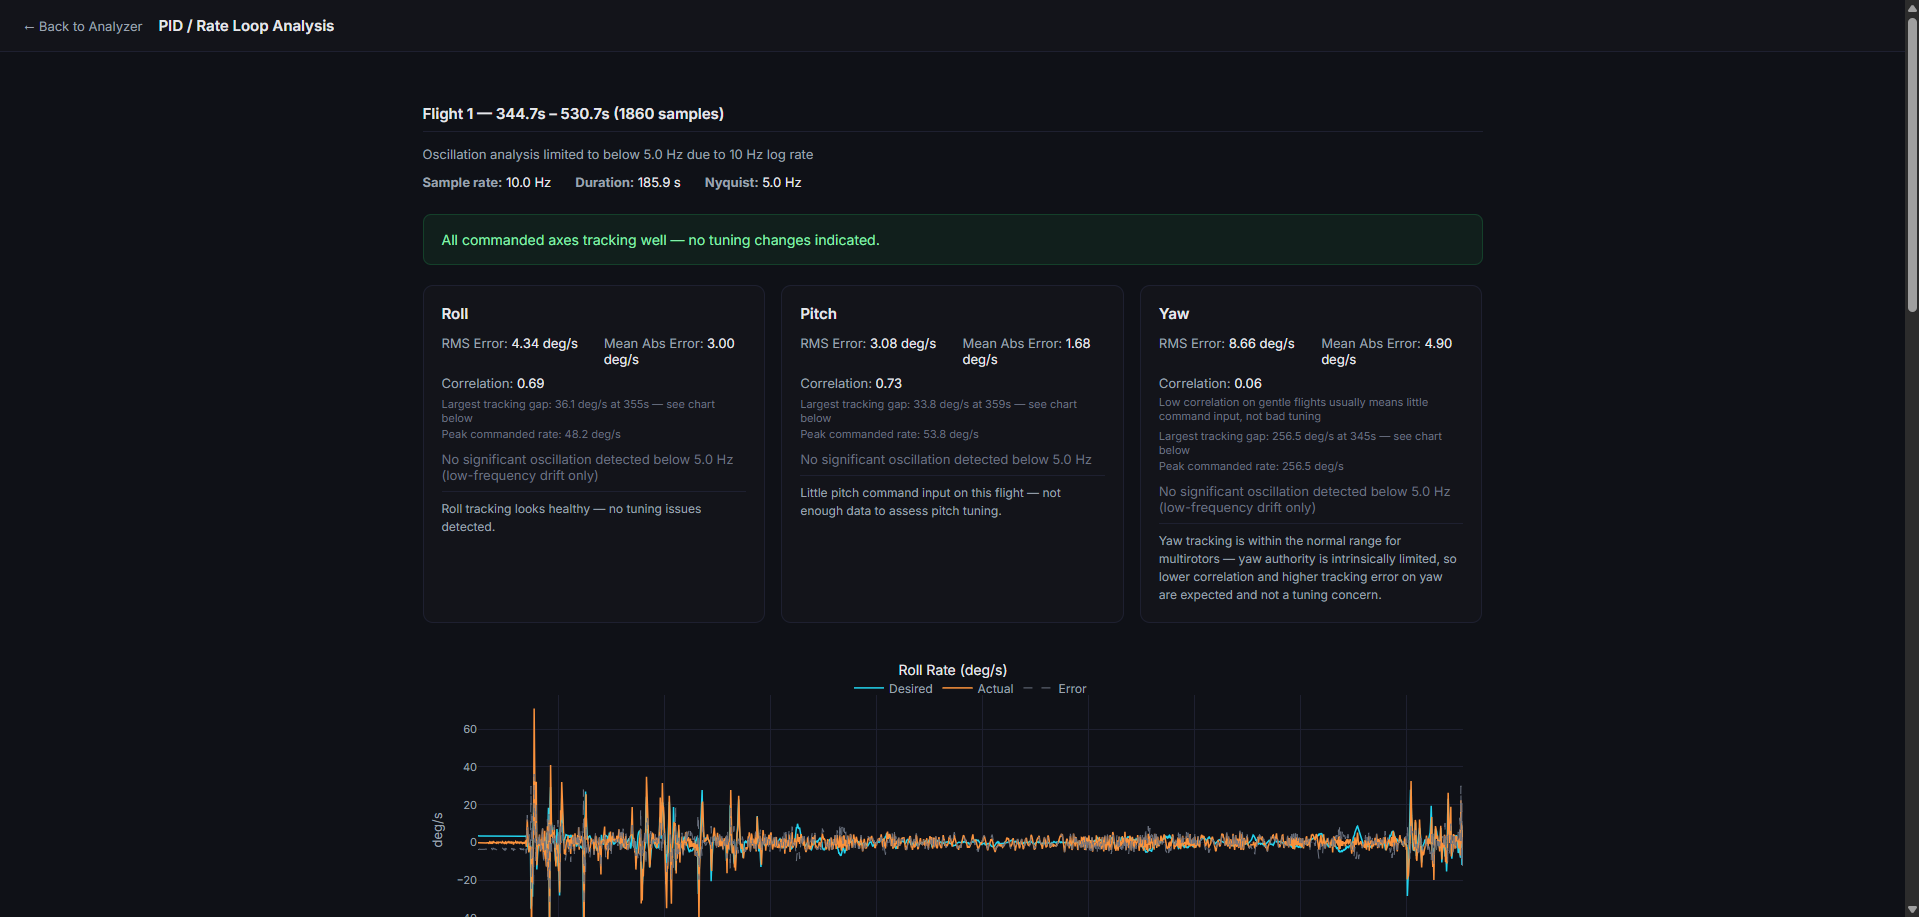
Per-axis tracking: RMS error, correlation, and plain-language notes. No gain values — by design.
3D flight path
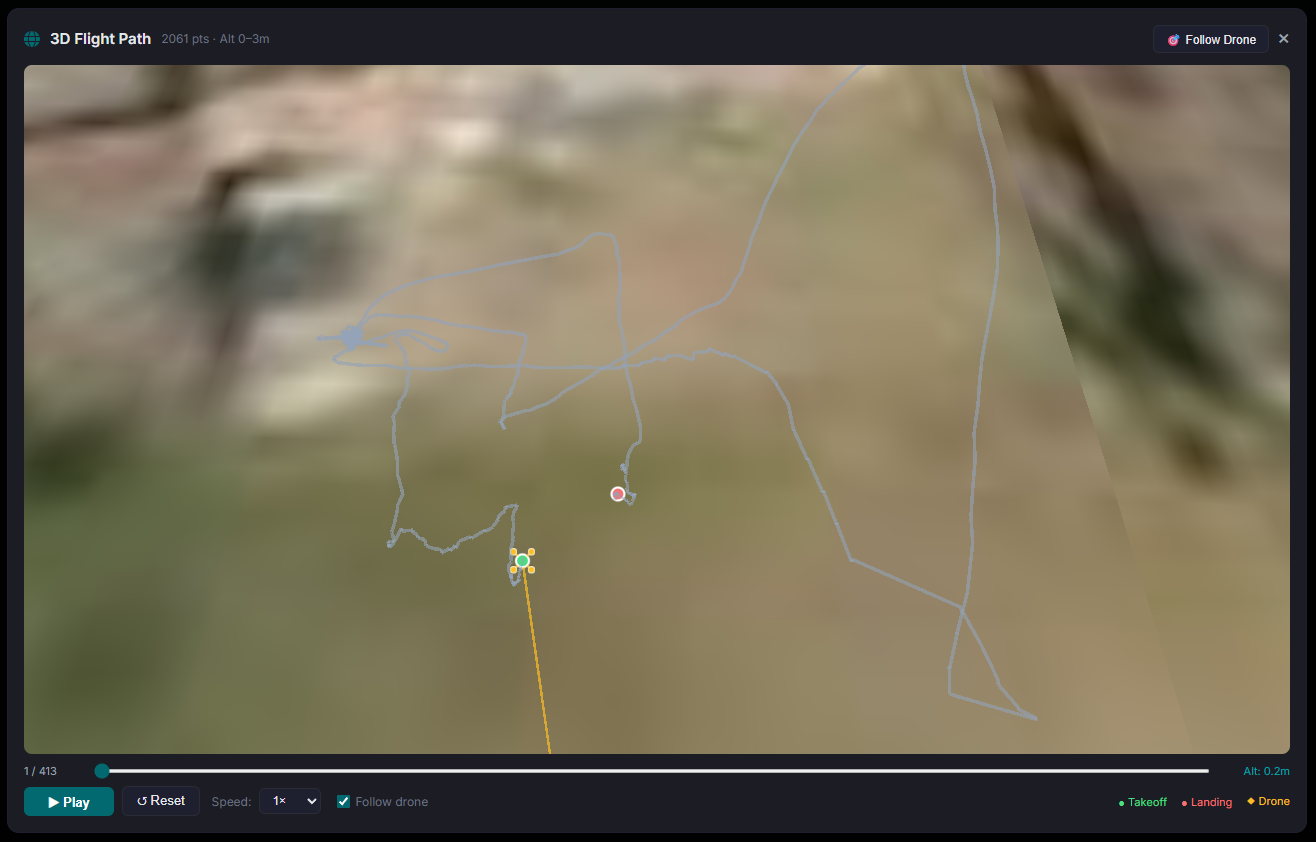
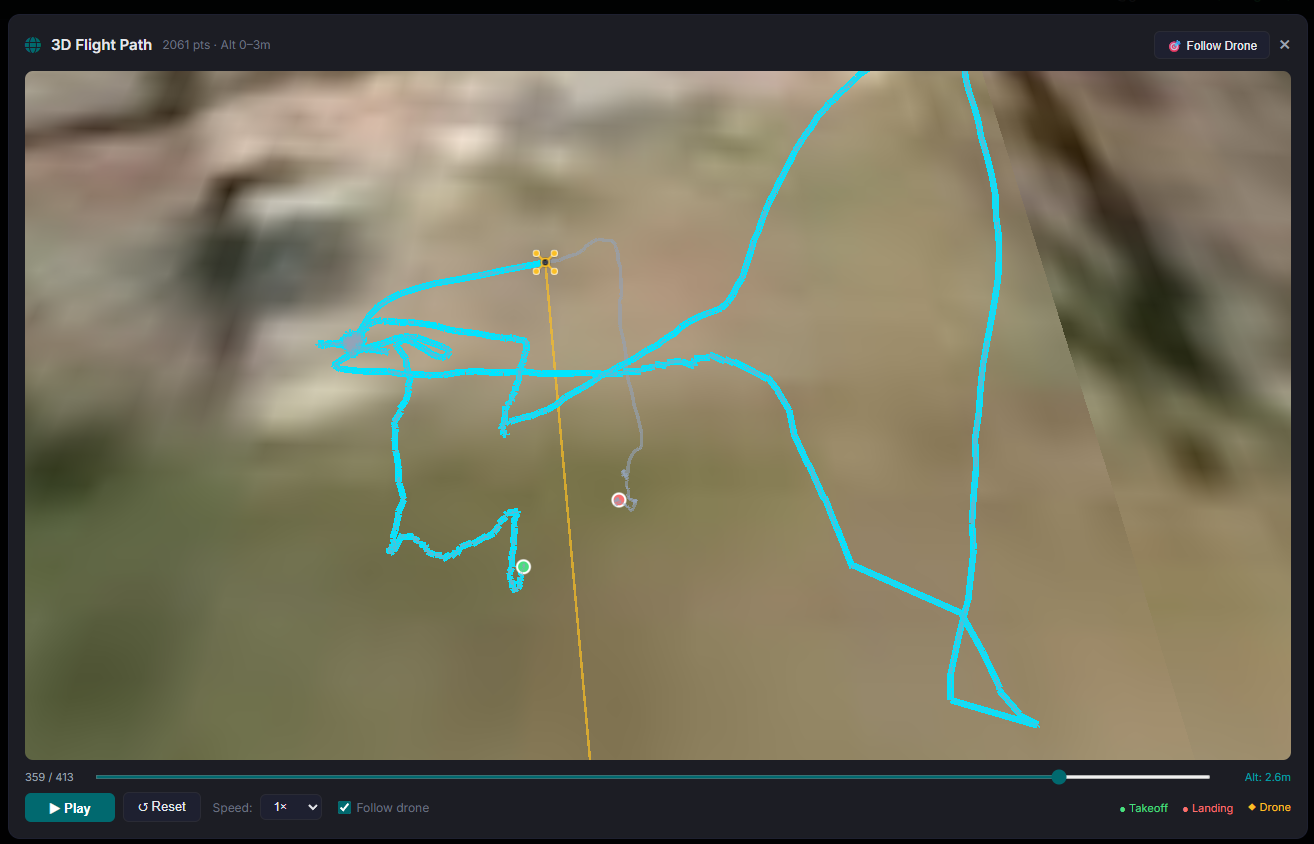
EKF-fused path on 3D terrain with playback. Takeoff, landing, and drone position marked.